Register and dashboard
The dashboard
Section titled “The dashboard”After logging in you arrive at the Risk dashboard. The key figures are at the top. A risk manager can click one to open the matching list.
| Key figure | What it counts |
|---|---|
| Assessments | All assessments, including drafts and retired risks. |
| Approved | Risks that have been approved. |
| Overdue | Approved risks whose reassessment is late. |
| Open controls | Measures with status Open or In progress. |
| Without an owner | Risks under review or approved that have no risk owner. Only shown when there are one or more. |
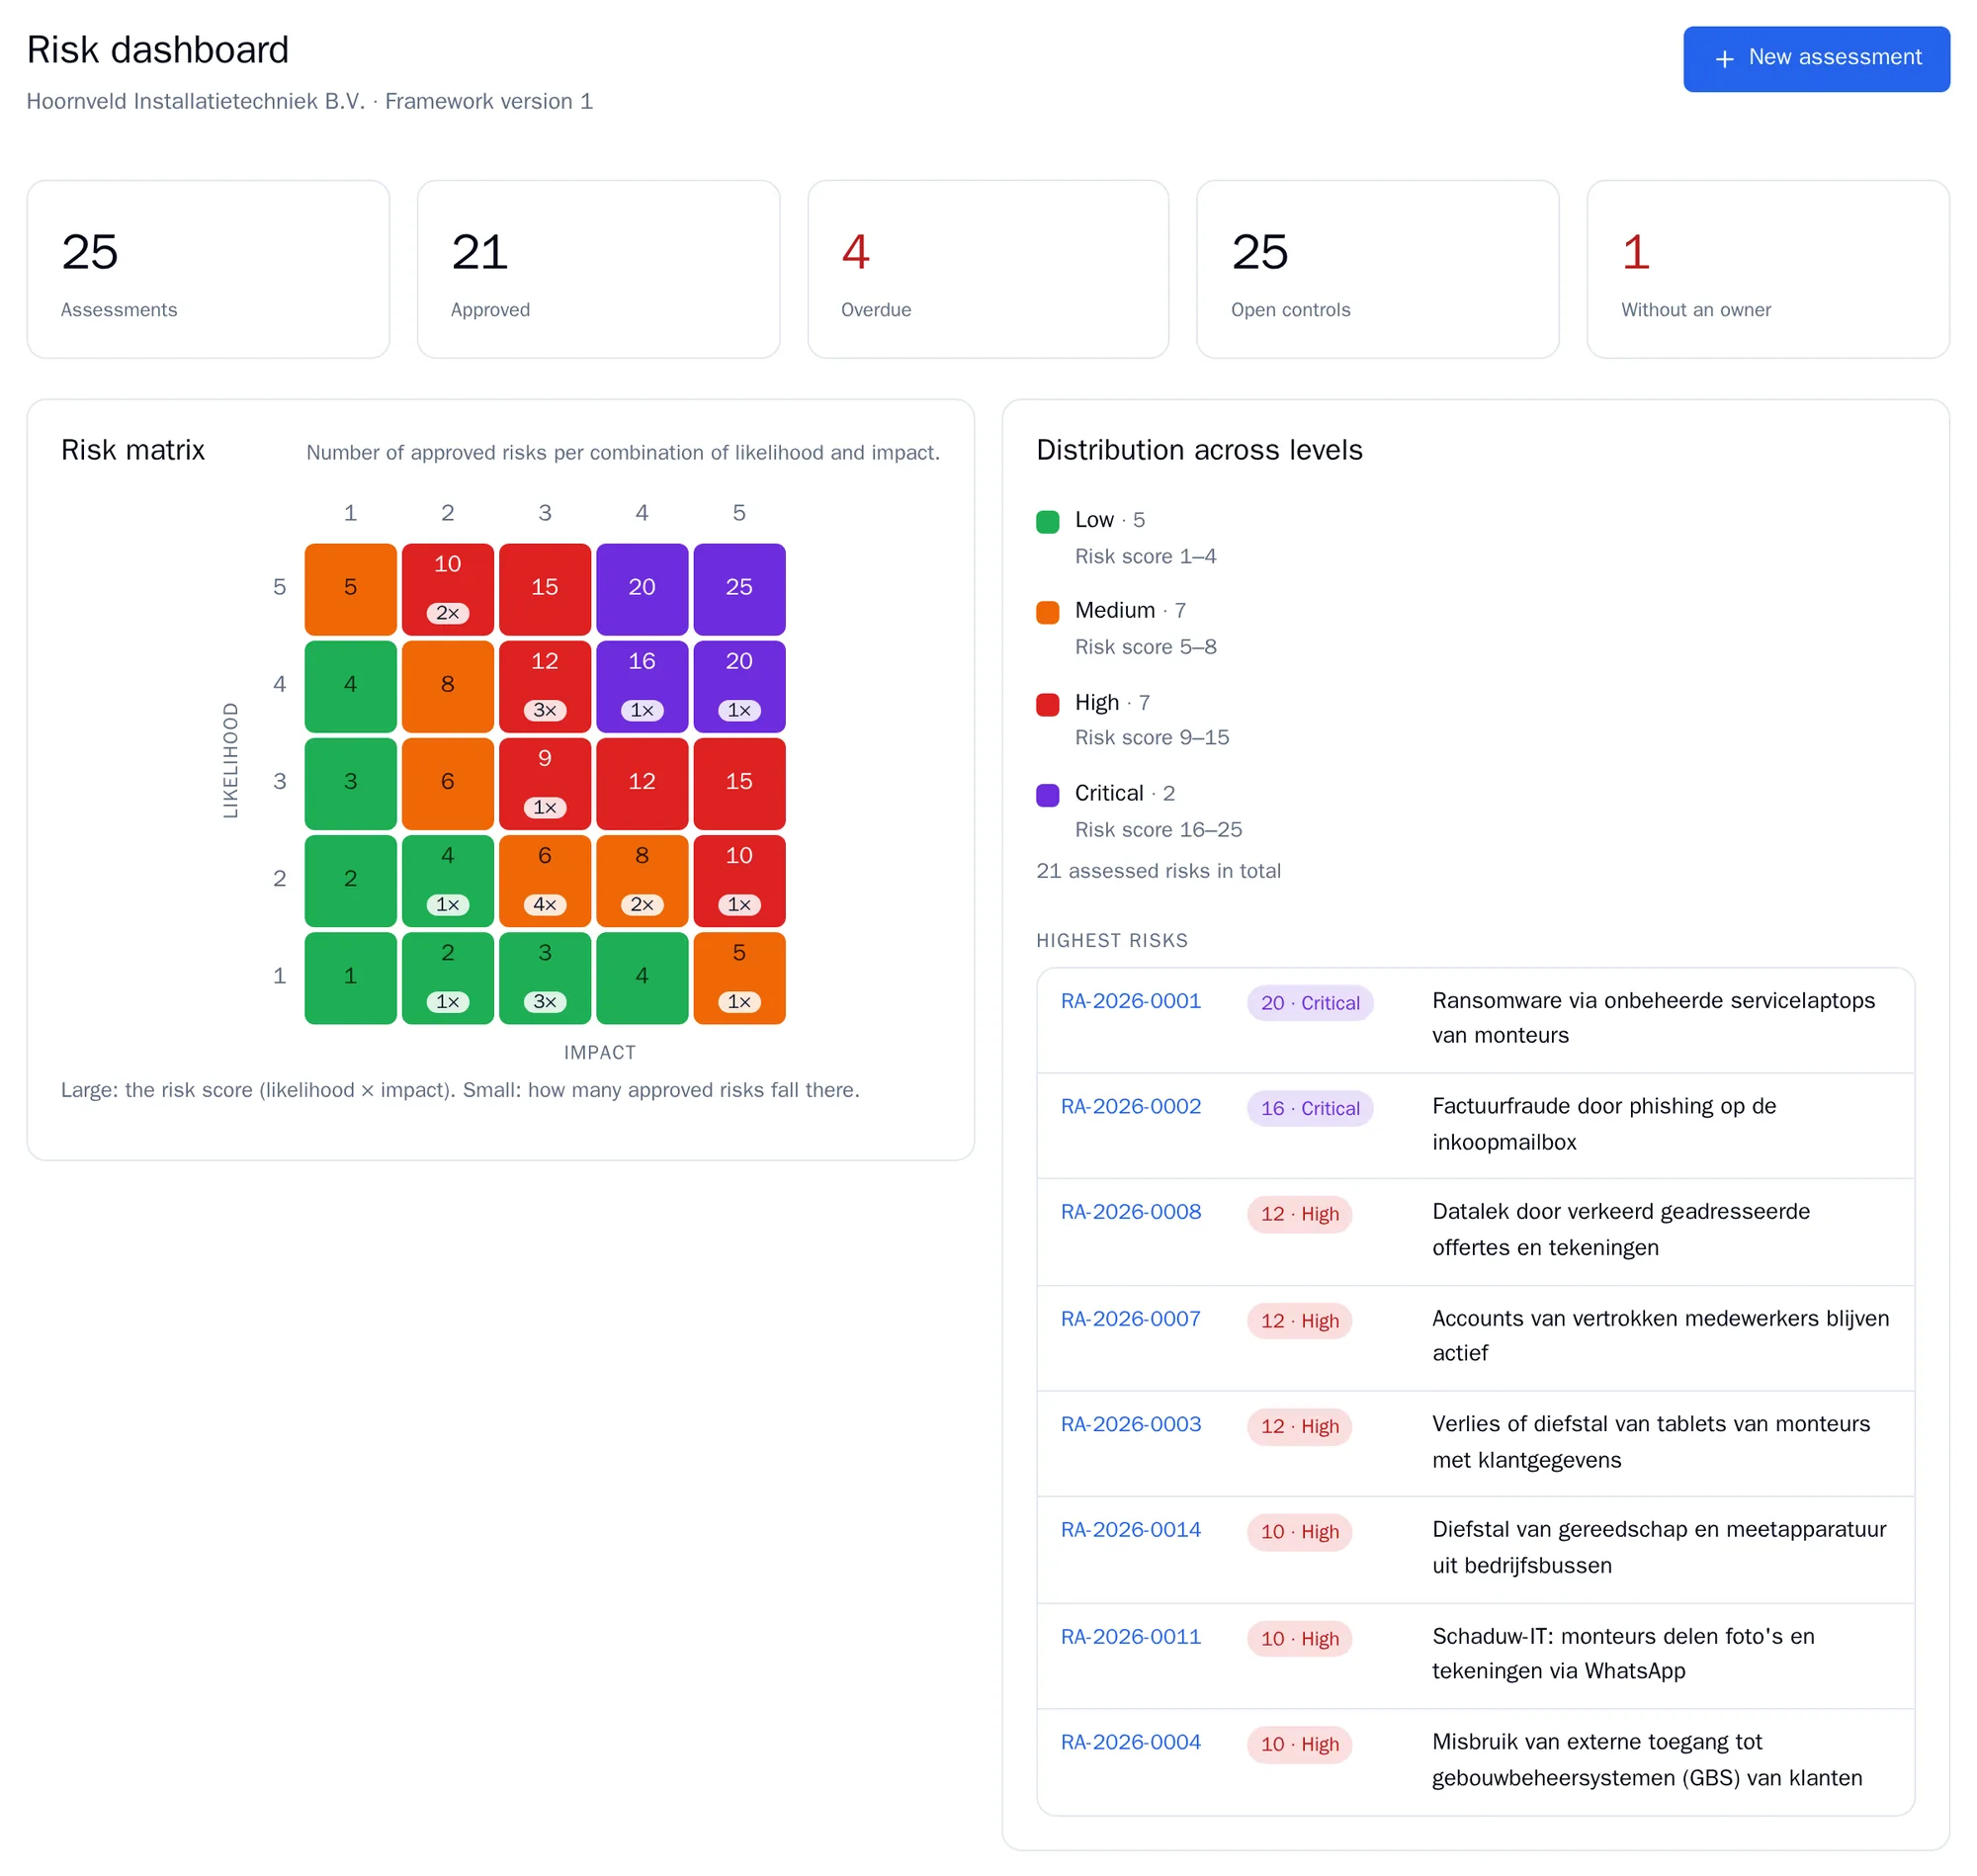
Below them:
- Risk matrix: impact from left to right, likelihood from bottom to top. The large number in a cell is the risk score, the small number is how many approved risks fall into it.
- Distribution across levels: how many risks are Low, Medium, High and Critical.
- Highest risks: the eight approved risks with the highest score.
- Open alerts: risks that deviate from your policy.
The matrix, the distribution and the highest risks only count approved risks.
If there are no assessments at all yet, the dashboard shows Getting started with the first steps.
The risk register
Section titled “The risk register”Go to Risk register (from risk manager). It lists all risks in your organisation, by default sorted by risk score from high to low.
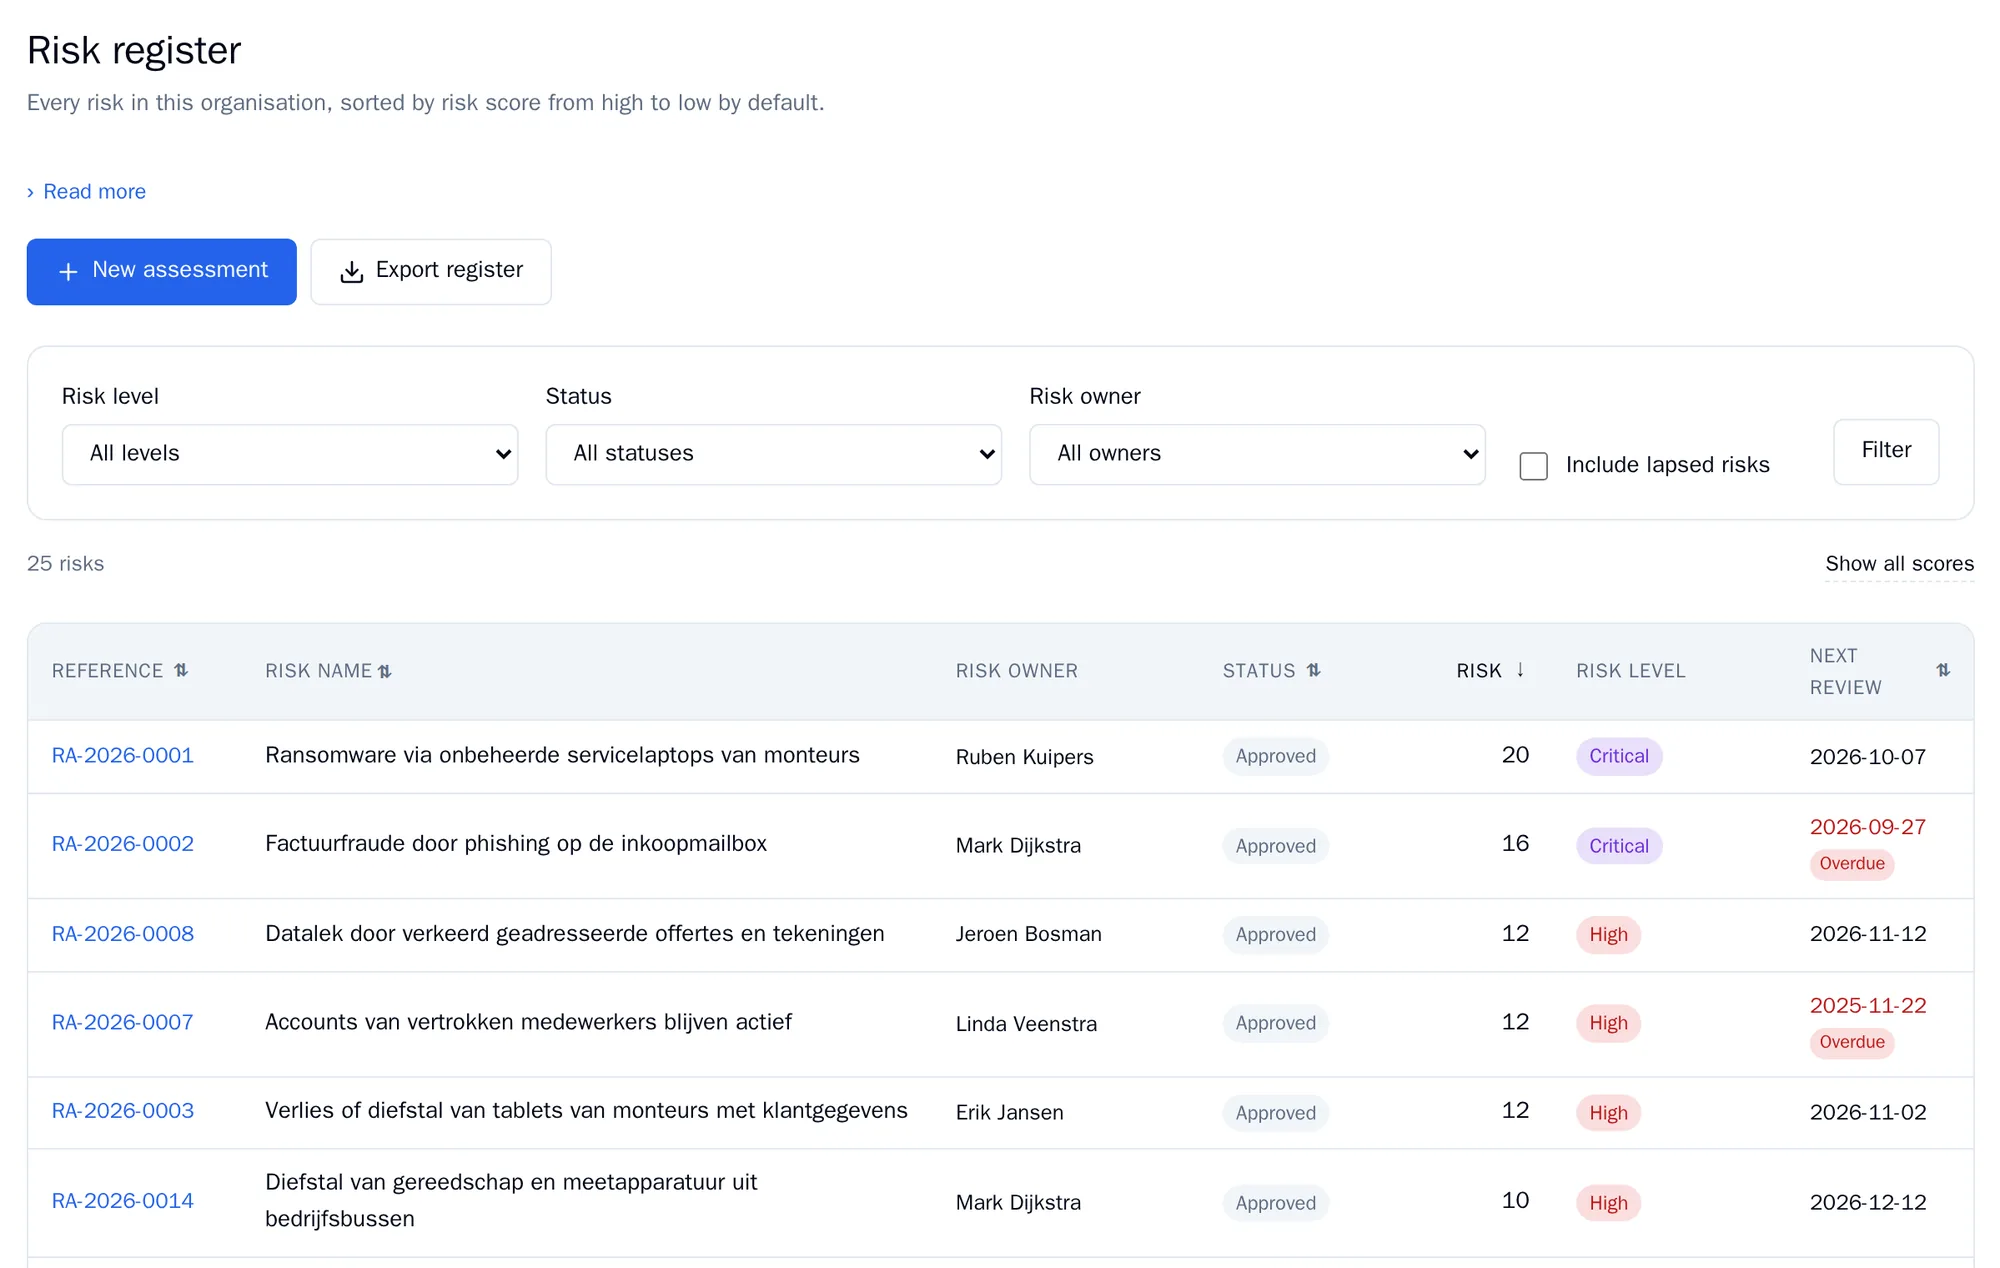
Filtering: choose a Risk level, a Status, or under Risk owner the risks without an owner, and click Filter. Retired risks are hidden by default. Tick Include lapsed risks to see them.
Sorting: click a column heading, for example Risk or Next review. Click again to reverse the order.
More columns: click Show all scores for impact, likelihood and the last check. Use Fewer columns to go back.
A red date with Overdue means the reassessment is late.
Exporting to Excel
Section titled “Exporting to Excel”Click Export register. You get the register as an Excel file. The export is recorded in the audit log.