Progress and reports
Administrators, ISOs and managers see their people’s progress under Insights. A manager sees the figures for their own team.
Insights
Section titled “Insights”Insights has five sections:
| Section | What you see |
|---|---|
| Overview | The most important figures at a glance, with shortcuts to the other sections. |
| Reports | Completion per department and per campaign, with downloads. See below. |
| Risk | The risk score of the organisation, per department and per employee. See The risk score. |
| Trends | How completion develops, over 7 days, 30 days, 90 days, a year or a custom period. Use Compare with previous period to put two periods side by side. |
| Gamification | Points, badges and participation. |
Looking at the figures
Section titled “Looking at the figures”- Go to Insights and choose Reports.
- At the top are the number of employees, the number of completed trainings, the completion rate and the average score.
- Below that you see completion per department and the trend over the past 30 days, and tables per campaign and per department.
- To look at one campaign, choose it under Filter by campaign.
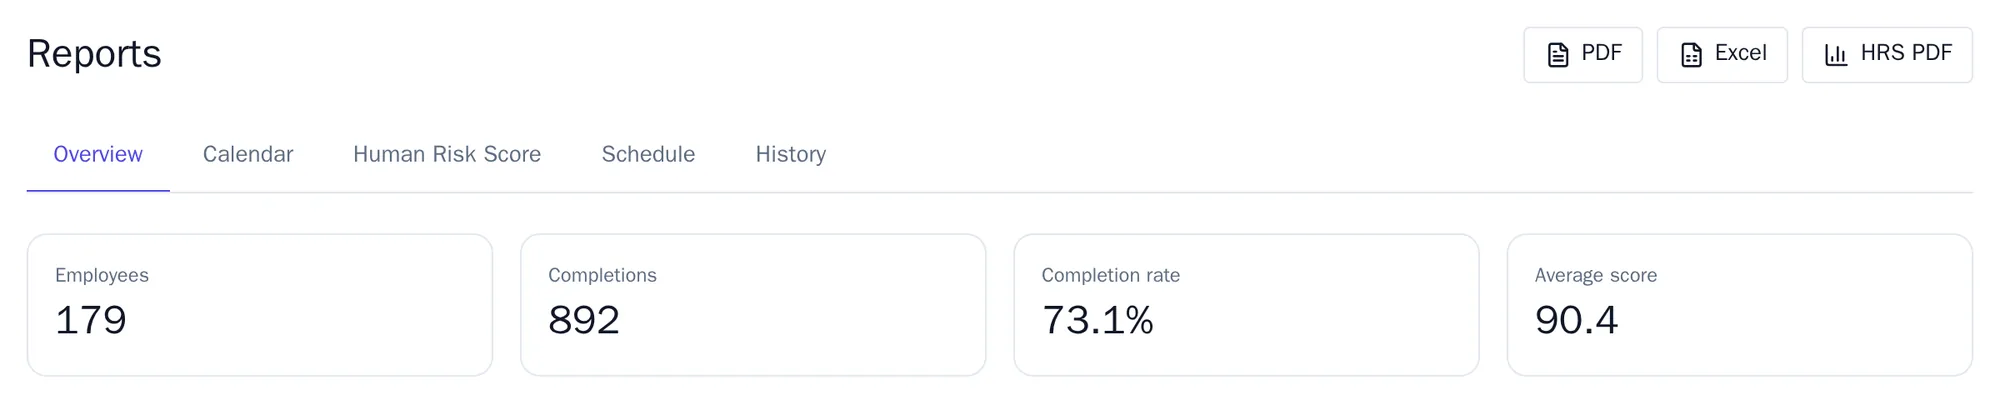
The Calendar tab shows this week’s deadlines. The Human Risk Score tab shows the risk score in figures.
Downloading a report
Section titled “Downloading a report”Click PDF, Excel or HRS PDF in the top right. HRS PDF is the report on the risk score. The file downloads as soon as it is ready. Administrators, ISOs and managers can download.
Having a report emailed
Section titled “Having a report emailed”You do this as an administrator.
- Open the Schedule tab and click Schedule new report.
- Give the report a Name.
- Under Report type (multiple allowed), choose what goes into it: Summary, Campaigns, Departments and Human Risk Score.
- Under Schedule, choose how often: daily, weekly, monthly (on the first of the month) or quarterly.
- Under Recipients (one per line), enter the email addresses, one per line.
- Click Create.
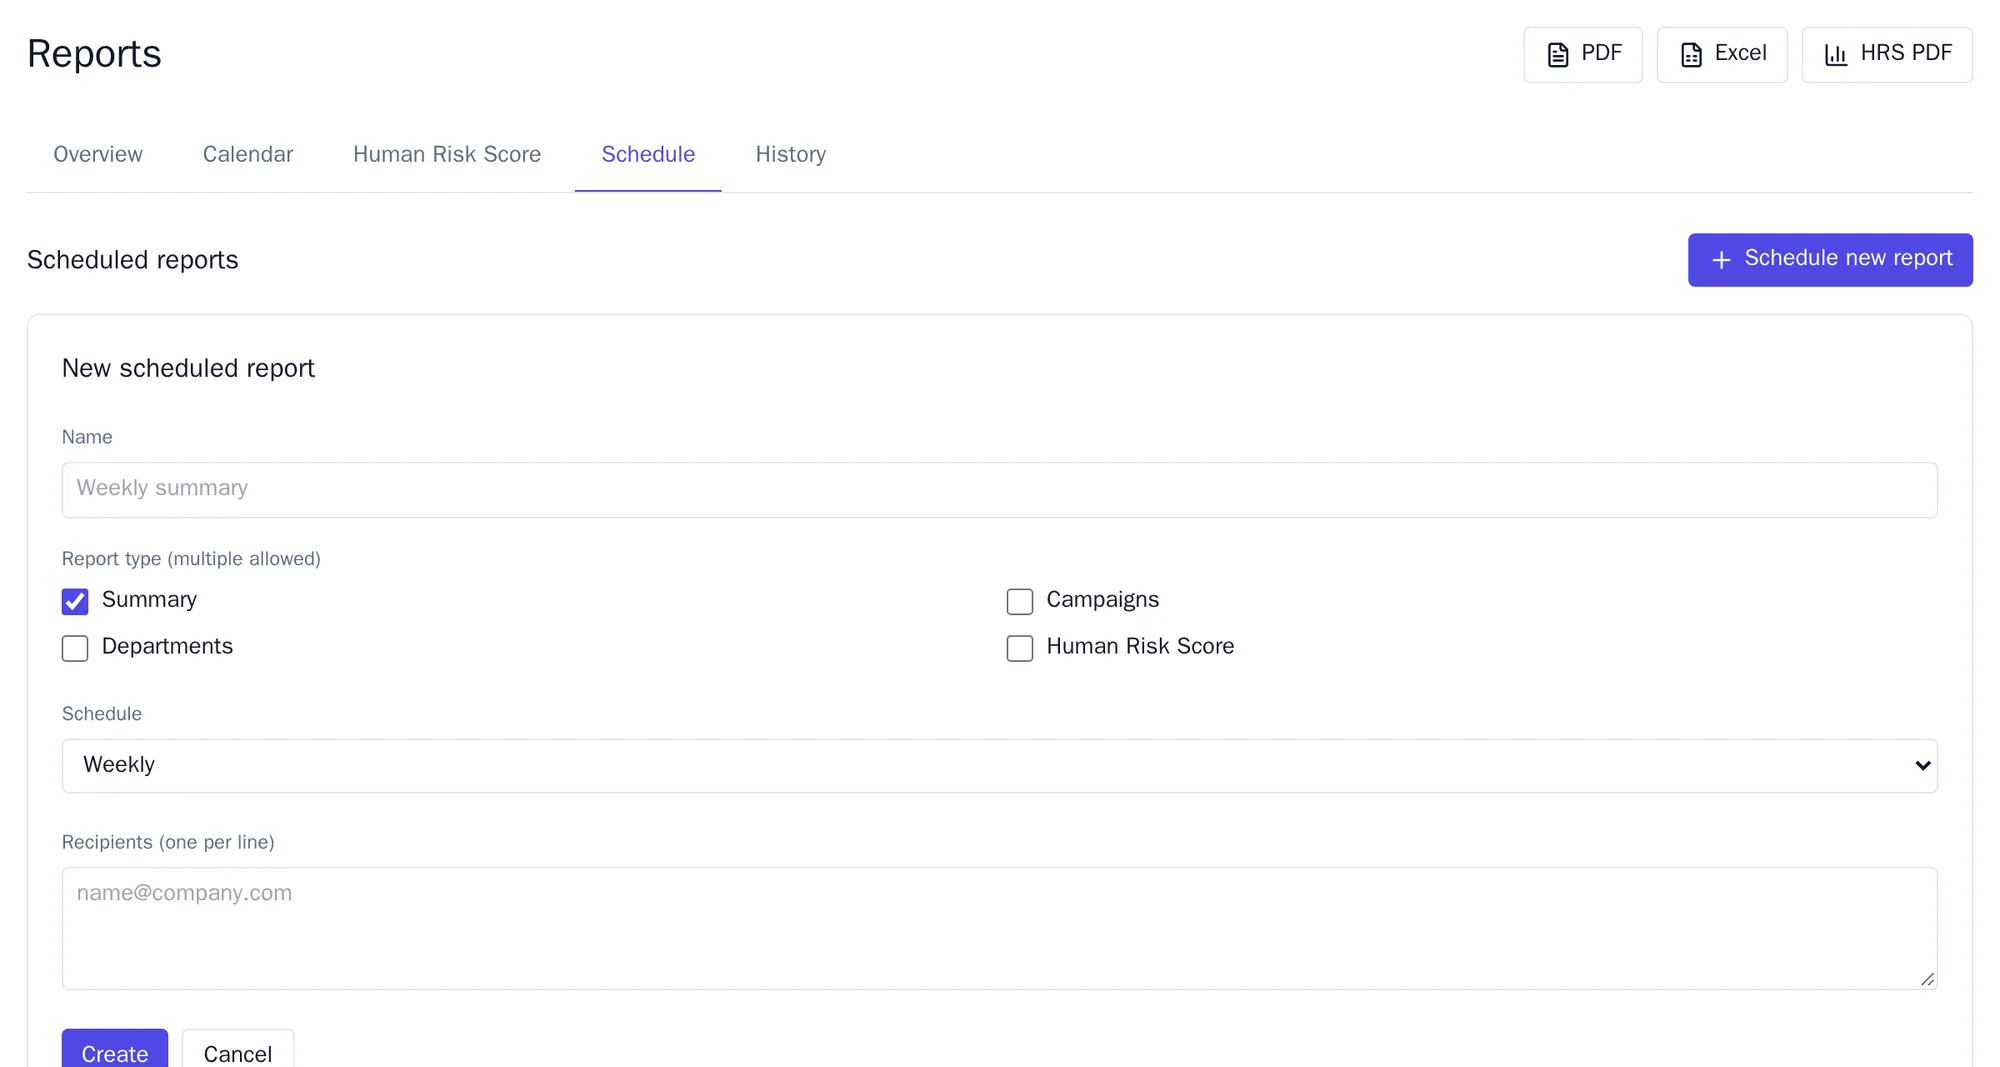
Reports that have already been sent are listed under History.
What the figures mean
Section titled “What the figures mean”- Completion rate is the share of assigned trainings that have been finished.
- Average score is the average across all completed trainings.
- The risk score is management information for your own use: it shows where attention is needed. It is not a certification and not proof that you meet a standard.